

MSME Briefing Bureau
Forecasts, factory costs and what founders must do now
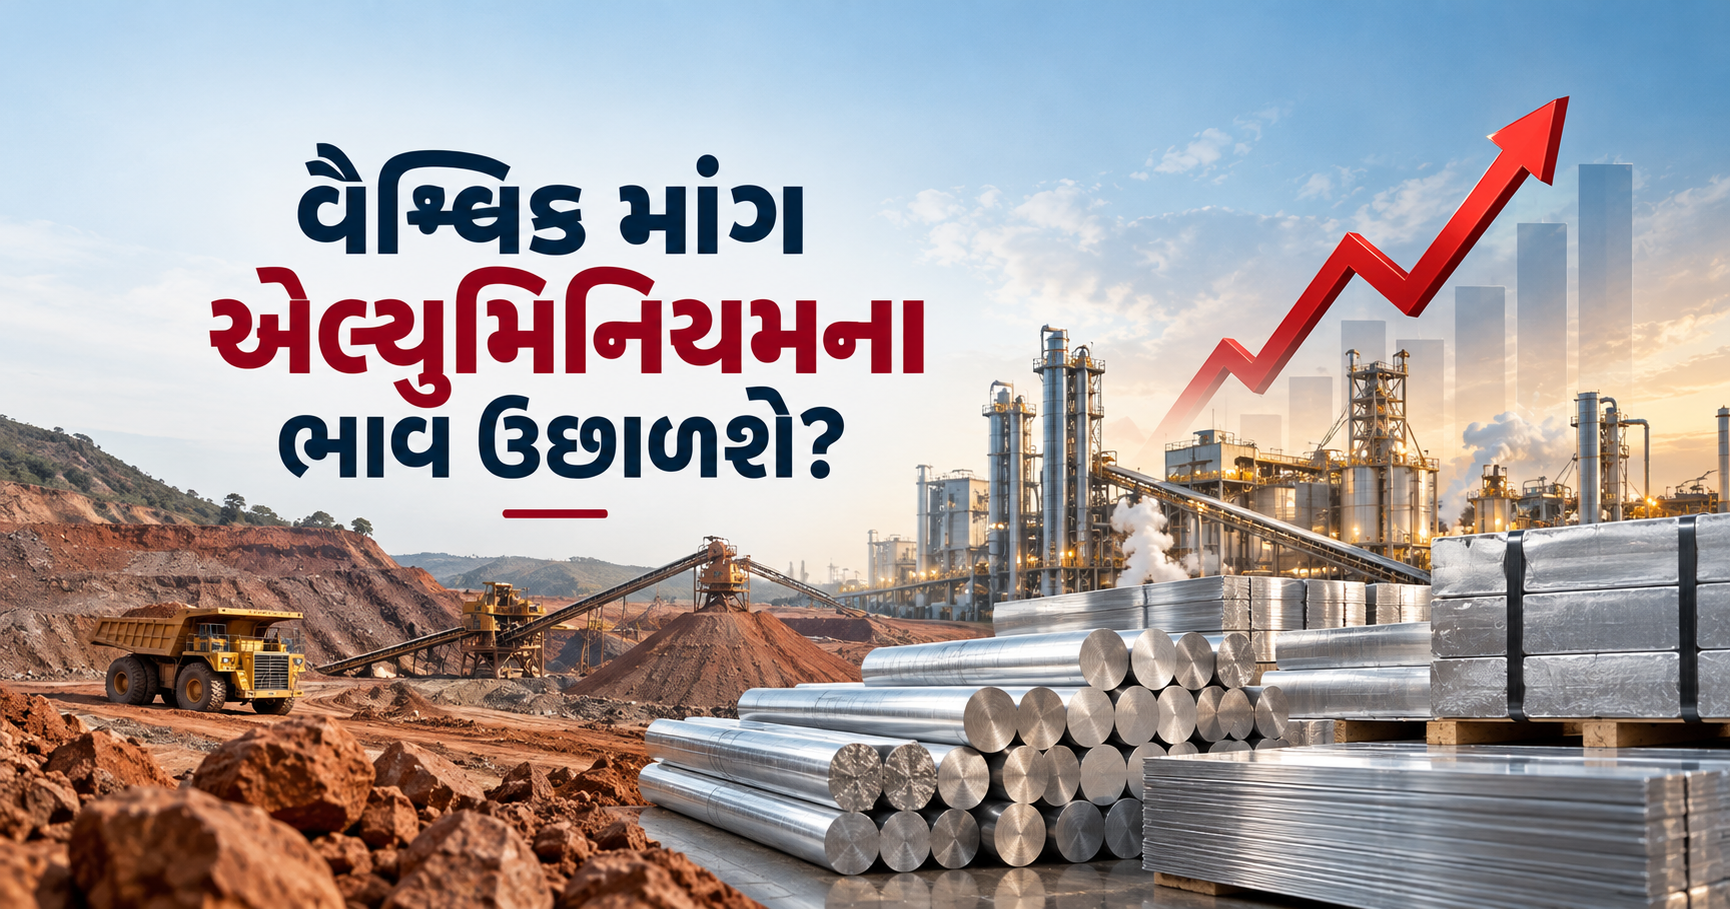
Aluminium prices could follow very different paths in 2027—from a correction to another supply-driven surge. For Indian MSME founders, the difference can mean lakhs of rupees in additional procurement costs. India is the world’s second-largest primary aluminium producer, yet its manufacturers remain exposed to global prices. From electrical conductors and solar structures to vehicles, utensils and homes, aluminium’s cost travels through the supply chain. What should founders and consumers prepare for before the next price movement?
2027: Will aluminium prices rise or fall?
The forecasts are divided. Goldman Sachs projected an average of US$2,700 per tonne (approximately ₹236/kg) for 2027, while J.P. Morgan forecast an annual average of US$3,075 per tonne (₹269/kg). A separate tight-supply scenario from CRU pointed to prices exceeding US$4,000 per tonne (₹350/kg).
These are competing forecasts, not a consensus.
| 2027 outlook | US$/tonne | Approx. INR/kg |
|---|---|---|
| Goldman Sachs: annual average | $2,700 | ₹236 |
| J.P. Morgan: annual average | $3,075 | ₹269 |
| J.P. Morgan: Q1 forecast | $3,450 | ₹302 |
| CRU: tight-supply scenario, Q2 | $4,105 | ₹359 |
Currency conversion uses ₹87.50 per US dollar. These are global benchmark equivalents, not Indian delivered prices.
Why could prices diverge so sharply? Energy costs, Chinese production, smelter disruptions, geopolitical tensions, industrial demand and global inventories will influence supply and demand. A weaker rupee can also increase the domestic cost of imported or globally benchmarked metal.
For founders, the lesson is not to bet on one forecast. It is to test whether the business can withstand a 10%, 20% or even 30% increase in its actual purchase price.
What happened in 2025–26?
NALCO’s published basic price for IE07 aluminium ingots rose from ₹270.25/kg in September 2025 to ₹354.95/kg in July 2026, an increase of approximately 31.3%. It subsequently eased from its June peak of ₹402.35/kg.
| Reference period | NALCO IE07 basic price |
|---|---|
| September 2025 | ₹270.25/kg |
| December 2025 | ₹296.05/kg |
| March 2026 | ₹339.45/kg |
| June 2026 | ₹402.35/kg |
| July 2026 | ₹354.95/kg |
| 1 October 2026 | ₹351.25/kg |
Grade-specific ex-works basic prices, excluding taxes and freight. These are selected price observations, not monthly averages.
For a manufacturer buying 10 tonnes, the September 2025 price represented approximately ₹27.03 lakh (US$30,886). At ₹354.95/kg, the same quantity cost approximately ₹35.50 lakh (US$40,566)—a difference of about ₹8.47 lakh (US$9,680) before taxes and freight.
That is the real business consequence: the same production requirement can demand substantially more working capital.
The comparison also demonstrates why founders must monitor their actual supplier prices alongside the London Metal Exchange (LME) benchmark. Domestic prices can move differently because of premiums, product grades, currency movements and commercial terms.
Where does India’s aluminium go?
The Ministry of Mines’ published sectoral breakdown identifies electrical applications as the largest reported consumer of aluminium.
| Sector | Share of reported consumption |
|---|---|
| Electrical and power | 48% |
| Automotive and transport | 15% |
| Construction | 13% |
| Consumer durables | 7% |
| Machinery and equipment | 7% |
| Packaging | 4% |
| Others | 6% |
These figures describe sectoral demand—not the share of aluminium in a finished product’s price.
The distinction matters because a power conductor may contain a very high proportion of aluminium by weight, while a car, air-conditioner or solar installation also contains many other materials and components.
Which products are most exposed?
The following are indicative applications and exposure ranges from the supplied research. Actual content varies by product design and specification.
| Product | Aluminium exposure | Potential consequence |
|---|---|---|
| Overhead conductors | Around 85–95% by weight in selected designs | Higher material costs for conductor makers and infrastructure contractors |
| Aluminium window profiles | Aluminium dominates the profile’s metal content | Higher fabrication costs and pressure on fixed-price building contracts |
| Automotive castings and alloy wheels | Aluminium can dominate the component’s metal content | Margin pressure on foundries and component suppliers |
| Utensils | Aluminium is the principal material in relevant products | Direct exposure to raw-metal prices |
| Solar mounting structures | Aluminium used in selected frames and structures | Higher component costs, but not an equivalent rise in total installation costs |
| Air-conditioners and refrigerators | Aluminium used in selected components; copper also matters | Impact varies with design and total manufacturing cost |
| Cans and foil packaging | Aluminium is a major material input | Higher packaging costs may feed through to packaged goods |
A metal-price increase does not translate automatically into the same percentage increase in the final product.
Consider a manufacturer with a ₹10 lakh (US$11,429) material bill. If aluminium accounts for 60% of that bill, a 20% increase in aluminium prices adds ₹1.20 lakh (US$1,371), raising the total material bill by 12%.
If aluminium accounts for only 25% of the bill, the same price increase raises total material costs by 5%.
The calculation helps founders identify their real exposure instead of relying on a generic commodity forecast.
India’s production paradox: Why are domestic buyers still exposed?
India produced approximately 4.2 million tonnes of primary aluminium in FY2024–25, becoming the world’s second-largest producer after China. Yet domestic production does not insulate downstream manufacturers from international prices.
One reason is import-parity pricing: domestic prices can be benchmarked against the cost of importing metal, including international prices, premiums, freight and applicable duties.
Downstream industry associations argue that this mechanism raises their input costs and weakens their competitiveness.
The supplied research also reports that India exported 17.51 lakh tonnes of aluminium in FY2024–25, down from 19.86 lakh tonnes in the previous year. Separately, calendar-year 2023 exports of aluminium and aluminium products were reported at US$7.3 billion (approximately ₹63,875 crore), including US$4.8 billion (₹42,000 crore) of unwrought or primary aluminium. These trade figures should be checked against the original product classifications before publication.
The industry debate extends to import duties. Downstream associations have cited an effective duty burden of 8.25% on primary aluminium and 2.75% on scrap, arguing that the structure disadvantages smaller manufacturers. The precise treatment depends on the applicable tariff and product classification.
The original research also cites an estimated US$470 million (approximately ₹4,100 crore) additional cost to downstream producers in 2022 associated with import-parity pricing. This is an industry-linked estimate, not an independently established economy-wide saving.
Primary producers have a counterargument: smelting requires substantial capital, energy, infrastructure and compliance expenditure. The policy challenge is to maintain viable primary production while improving the competitiveness of downstream manufacturing.
Electricity, construction and household costs
Aluminium’s reported 48% share of consumption in electrical applications makes the power sector particularly important.
Higher metal prices can raise the cost of overhead conductors, electrical equipment and grid expansion. That can put pressure on infrastructure budgets and contractors’ margins.
However, higher aluminium prices do not automatically increase household electricity tariffs. Tariffs also depend on generation costs, purchased power, transmission and distribution expenses, regulatory decisions and other factors.
The same distinction applies to other consumer products:
- Windows and roofing: fabricators may face higher material costs, but glass, fittings, labour and installation also matter.
- Vehicles: component suppliers can face pressure before any effect reaches showroom prices.
- Solar installations: aluminium affects selected frames and mounting structures, not the entire system in the same proportion.
- Appliances, utensils and packaging: the effect depends on aluminium content, inventories, conversion costs and the manufacturer’s ability to pass on increases.
Consumers may ultimately pay more for some products, but there is no reliable universal percentage linking aluminium prices to retail-price increases.
The other risk: Supply shortages and imported scrap
Recycling can reduce energy requirements and provide an alternative source of aluminium, but it does not eliminate price risk.
Industry estimates in the supplied research indicate that imported scrap meets approximately 80–85% of India’s scrap requirements. World Bank WITS/UN Comtrade data should be used to confirm the relevant import volumes and reference period before publication.
Scrap prices remain exposed to overseas supply, freight, exchange rates, contamination and competition from other buyers. Recycled metal also cannot replace every alloy or grade.
For founders, the correct comparison is the delivered cost of usable metal, including processing, yield and quality risk.
What founders should do before 2027
A business spending ₹20 lakh (US$22,857) on aluminium for a production cycle would need an additional ₹2 lakh (US$2,286) if its actual purchase price rose by 10%, or ₹4 lakh (US$4,571) if it rose by 20%, assuming unchanged quantities.
Five measures can reduce exposure:
- Build price-escalation clauses into long-duration contracts, using a clear benchmark, base price and revision formula.
- Shorten quotation validity where supplier prices can change faster than customer prices.
- Qualify alternative suppliers and grades before a shortage occurs.
- Improve material yield and scrap recovery without compromising product specifications.
- Stress-test working capital under 5%, 10%, 20% and 30% price-increase scenarios.
Supplier forward contracts or financial hedges may help some businesses, but they introduce their own costs and risks. The hedge must match the actual metal exposure; it should not become speculative trading.
The bottom line
India’s aluminium production strength does not guarantee stable prices for downstream manufacturers. The 2025–26 price movement demonstrates how quickly procurement costs can change, while the 2027 forecasts show why businesses should prepare for more than one outcome.
For MSMEs, the priority is to know the aluminium share of product costs, understand supplier-price movements, protect contract margins and maintain enough liquidity to withstand a price shock or supply interruption.
For consumers, the impact will vary across electricity infrastructure, construction, vehicles, appliances, solar systems and household goods. Higher aluminium prices can raise costs along the supply chain, but the final effect depends on the product and the extent to which businesses pass on the increase.
The founder who calculates the exposure before accepting an order is better prepared than the one who discovers the cost after the margin has disappeared.
Sources and research credits
- Ministry of Mines, Government of India — Aluminium Vision Document, covering production, sectoral consumption, pricing, downstream competitiveness and recycling.
https://www.mines.gov.in/admin/download/686b72a13ed1e1751872161.pdf - NALCO IE07 price history, reproduced from domestic price circulars; basic prices exclude taxes and freight.
https://snalco.com/nalco-aluminium-price-history/ - J.P. Morgan Global Research — Aluminium price forecasts for 2026–27.
https://cws-main-ndc.jpmorgan.com/insights/global-research/commodities/aluminum-steel-copper-prices - Goldman Sachs, as reported in July 2026 — Revised aluminium price forecast and supply outlook.
https://www.tradingview.com/news/reuters.com%2C2026%3Anewsml_FWN438010%3A0-goldman-sachs-lowers-q4-2026-aluminium-forecast-to-2-950-t-and-2027-average-forecast-to-2-700-t/ - CRU, as reported by the Indonesian Mining Association — Tight-supply aluminium scenario for 2026–27.
https://ima-api.org/cru-sees-aluminium-prices-above-4-000-t-due-to-iran-war/ - ASMA, CACMAI and FAIAUM industry representations, as reported by The Economic Times and Business Standard — Import-parity pricing, duty structure and downstream competitiveness.
- World Bank WITS / UN Comtrade — Aluminium and scrap trade statistics.
https://wits.worldbank.org/
Editorial note: Forecasts are attributed projections, not guaranteed outcomes. Product-level exposure ranges are indicative, and the cost examples are calculations rather than industry averages. The export-value breakdown and the ₹4,100 crore import-parity estimate should be checked against their original sources before publication. INR conversions use an illustrative exchange rate of ₹87.50 per US dollar.



Leave a Reply