

By Haresh B. Jhala:
MSME Briefing’s September warning meets the Diwali consumer shift now!
On 15 September 2026, MSME Briefing warned that food inflation could change what India bought, not simply how much it spent. Diwali’s retail numbers now offer a test of that reading. FMCG sales value accelerated, rural markets outpaced urban markets, and consumers faced higher prices, smaller packs and shifting brand choices. Yet festive stocking and wider distribution also lifted sales. The real question is not whether the market grew, but what growth it really recorded.
The Diwali sales paradox: More value, but what volume?
India’s FMCG market recorded a significant acceleration during October 2026, with festive-season sales value growth reaching approximately 14.1% year-on-year, compared with 9.5% in September and 6.8% in October 2025, according to the detailed retail tracker. Another contemporaneous industry report put October growth at approximately 15%.
The performance appears encouraging. However, higher sales value does not automatically mean proportionately higher physical consumption.
The distinction is important because manufacturers have been navigating higher raw-material costs, selective price increases, changes in product grammage and a consumer base increasingly conscious of affordability.
The October growth also benefited from a concentrated festive calendar. Navratri, Dussehra, Durga Puja and early Diwali stocking fell within the same month, compared with a more dispersed festive trading pattern in the previous year.
The immediate question for FMCG manufacturers is whether October’s growth represents stronger consumer offtake, higher realisations, improved distribution or a combination of all three.
The answer matters for production planning, inventory, capacity utilisation and working capital.
1. MSME Briefing’s September 15 warning: What changed in the consumer basket?
In its September 15, 2026 article, “Inflation May Change What India Buys Now”, MSME Briefing highlighted a structural risk to festive consumption.
The article argued that persistent food inflation would absorb a larger share of household expenditure, leaving less disposable income for non-essential purchases.
It identified five likely consequences:
- Down-trading: Consumers shifting from established national brands to cheaper regional and unbranded alternatives.
- Smaller packs: Greater reliance on ₹5, ₹10 and ₹20 low-unit-price packs.
- Shrinkflation: Manufacturers reducing product weight rather than increasing the printed retail price.
- Deferred purchases: Households extending product-replenishment cycles and postponing discretionary expenditure.
- Margin pressure: Manufacturers absorbing part of the increase in input costs or passing it on through calibrated price adjustments.
The September analysis made an important distinction: India was not necessarily heading towards a consumption collapse; the composition of consumption was likely to change.
The subsequent festive-season evidence supports examining precisely this shift.
Food inflation reached 7.74% in September 2026, with rural food inflation at 8.06% and urban food inflation at 7.18%. This was a substantial increase from the combined 5.97% recorded in August. Press Information Bureau
For households already allocating a significant proportion of expenditure to food and essentials, this creates pressure on discretionary budgets.
The September warning was not about whether consumers would celebrate Diwali. It was about what they could afford to buy while celebrating it.
2. The price-versus-quantity equation: How manufacturers protected their margins
One of the most important findings in the research is the contribution of price increases to FMCG revenue growth.
The October retail analysis indicates that category-specific price increases contributed approximately 8–9 percentage points to overall value expansion.
However, pricing strategies differed across categories.
- Edible oils recorded price increases within the commodities basket.
- Packaged foods and dairy products witnessed price increases of approximately 10%–15%, depending on the category.
- Spices experienced relatively little price movement.
- Selected consumer products also faced input-cost pressures from tea, edible oils and packaging materials.
This is important because manufacturers do not always respond to inflation by increasing the printed retail price.
Some companies raise prices; others reduce the quantity in a pack while retaining the existing price point. Some absorb a portion of the increase through lower margins.
Consider the following illustrations from the working research:
| Existing pack | Illustrative revised pack | Reduction in quantity |
|---|---|---|
| Biscuits – 100g at ₹10 | 88g at ₹10 | 12% |
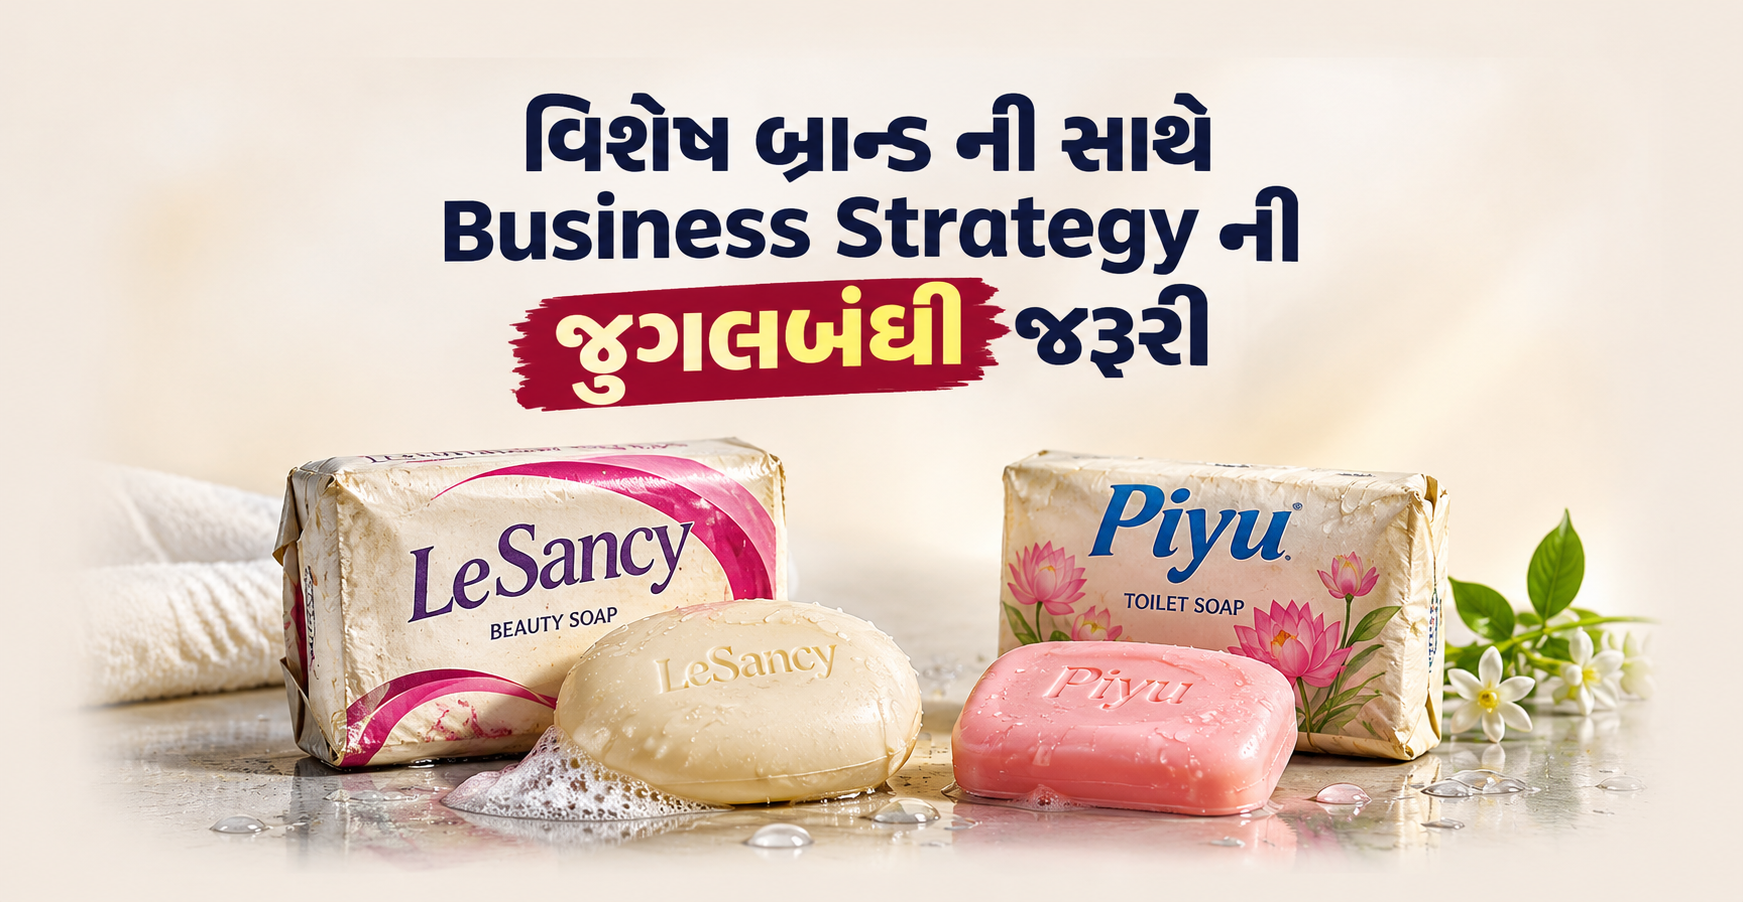
| Soap – 100g at ₹10 | 90g at ₹10 | 10% |
These are illustrations of the shrinkflation mechanism, not independently verified company-specific product changes.
The commercial logic is straightforward. A manufacturer retaining a ₹10 price point can protect affordability at the checkout while reducing the quantity supplied.
For the consumer, however, the effective price per gram increases.
A stable printed price does not necessarily mean a stable product price.
This distinction is particularly relevant for mass-market FMCG categories, where consumers are sensitive to small changes in retail prices.
It also explains why revenue growth must be examined alongside physical quantities, grammage, product mix and consumer offtake.
3. Rural versus urban India: Why did rural FMCG markets outperform?
17%
Rural value growth
October · one reported tracker
11%
Urban value growth
October · same reported comparison
Rural markets recorded stronger FMCG value growth than urban markets during October. The difference is significant, but it requires a closer examination of the economic factors influencing rural consumption.
The stronger rural performance cannot simply be attributed to improved agricultural income.
India’s 2026 southwest monsoon ended at approximately 87% of its Long Period Average, with cumulative rainfall of 759.4 mm against the normal 868.6 mm. The deficit was particularly pronounced in several eastern and southern regions.
The consequences were visible in agricultural indicators. Kharif sowing acreage was approximately 1.2% lower year-on-year at the end of September, with contractions across several major crops. Lower acreage, uneven rainfall and moisture stress also created risks for crop yields and subsequent agricultural output. Agriculture – Business Standard+1
The outlook for rural farm incomes therefore needs caution.
What, then, explains stronger rural FMCG sales?
Non-agricultural employment and household income
Rural purchasing power is increasingly influenced by income sources beyond agriculture.
Factory employees, industrial contract workers, construction labourers, transport operators and workers in ancillary manufacturing units contribute to household expenditure in villages surrounding industrial clusters.
The April–June 2026 labour-force data showed that the share of rural employment in the secondary sector, including mining and quarrying, increased to 24.4%, from 22.6% in the preceding quarter. The share in tertiary-sector employment also increased to 22.7%. Regular wage and salaried employment in rural areas rose to 16.1% of employment, from 15.5% in the previous quarter. Press Information Bureau
This provides a useful economic context for understanding rural consumption.
Industrial wages can support rural household purchases even when agricultural incomes face pressure. The extent of this contribution to October’s FMCG growth, however, requires further investigation.
Government expenditure and infrastructure activity
Public infrastructure expenditure can support rural employment through construction, transport, logistics and associated services. The transmission into household income depends on actual project execution, local hiring and wage payments.
It should therefore be considered a possible contributor, not an established explanation for the October sales figures.
Distribution expansion and product availability
There is more direct evidence of another driver.
Product placement across rural retail outlets increased 9% year-on-year in October, compared with 6% in urban markets. Overall product placement increased 8%.
Improved direct distribution, wider retail coverage and better festive stocking helped manufacturers reach more consumers, particularly in non-urban markets. The Financial Express+1
Low-unit-price packs
Smaller packs also matter. ₹5, ₹10 and ₹20 products allow households to purchase essentials without committing a large amount of cash at one time.
This may sustain transaction frequency even when consumers are unable or unwilling to purchase larger packs.
The impact of the monsoon may also emerge with a lag. Earlier harvest receipts, accumulated savings and seasonal cash flows can temporarily support festive expenditure even when subsequent agricultural income is uncertain.
The conclusion: Rural FMCG growth may reflect non-farm employment, wider distribution, festive stocking and affordable pack formats alongside agricultural income. It should not be interpreted as proof of improving farm prosperity or a 17% increase in physical consumption.
4. Category-wise performance: Where did consumers change their buying behaviour?
The aggregate FMCG number hides significant differences between categories. The pressure on household budgets, manufacturers’ pricing decisions and consumer preferences did not affect every product segment equally.
The category-level research identifies the following patterns.
| Product category | Reported market trend | Consumer and business implications |
|---|---|---|
| Edible oils | National branded volume flat to -2% in selected estimates | Smaller packs, regional brands and unbranded alternatives |
| Tea and spices | Higher input-cost exposure; pricing varied by category | Price sensitivity and substitution between brands |
| Biscuits and mass snacks | Estimated volume growth of 1%–3% | ₹5/₹10 packs, reduced grammage and value alternatives |
| Soaps and detergents | Estimated underlying volume growth of 1%–3% | Regional brands, smaller packs and longer replenishment cycles |
| Premium chocolates and gourmet products | Stronger premium demand | Affluent consumers continued spending on higher-value products |
| Sweets and festive gifting | Mid-tier branded gifting faced affordability pressures | Local sweet shops and regional namkeen manufacturers gained an opportunity |
| Premium personal care and beauty | Double-digit growth reported in selected segments | Premiumisation and convenience-led online purchases |
Category growth and volume figures above are estimates in the working research, not a single comparable national retail-audit series. They require category-level source verification before publication as definitive market measurements.
There are some more specific findings worth highlighting.
Beverages, commodities and home care recorded non-urban value growth of 19.2%, 20.4% and 18.8%, respectively. Urban packaged foods grew 19.3%, ahead of 16.5% in non-urban markets.
These category comparisons show why aggregate rural and urban growth figures can be misleading. Different product categories are driving growth in different markets. Bizom
For manufacturers, the implication is that a uniform national pricing or distribution strategy may not work equally well across categories and geographies.
The national-brand versus regional-brand competition
The research identifies several areas where regional manufacturers could gain from changing consumer preferences.
Snacks and namkeen: Consumers comparing price per gram may reconsider national brands when local manufacturers offer competitive quantities and pricing.
Sweets and confectionery: Local halwais and regional sweet manufacturers can compete with branded gifting packs through freshness, regional preferences and more affordable product combinations.
Detergents and soaps: Smaller manufacturers can compete through local distribution, affordable price points and retailer relationships.
Edible oils and packaged staples: Regional brands, private labels and unbranded alternatives can attract consumers when branded products become relatively expensive.
The research contains estimates of 15%–25% regional demand growth in selected categories, but these figures need independent confirmation. We should not interpret them as established national market-share gains.
Nevertheless, the competitive opportunity is significant.
For a regional FMCG manufacturer, the challenge is not simply to be cheaper than a national competitor. It is to deliver a credible combination of quality, quantity, price and availability.
5. Household budgets: The pressure beyond groceries
The September analysis also anticipated that food inflation would affect expenditure on apparel, gifting, travel and other discretionary purchases.
The subsequent consumer survey findings are particularly relevant.
| Urban festive spending indicator | 2026 finding |
|---|---|
| Households planning discretionary spending | 57% |
| Households planning zero discretionary spending | 31% |
| Average estimated festive discretionary spending | ₹20,000 |
| Estimated total urban festive spending | ₹1.97 lakh crore |
| Estimated urban festive spending in 2025 | ₹2.10 lakh crore |
| Year-on-year change | -6% |
| Spending households expecting to dip into savings | 83% |
| Spending households using savings for at least 25% of expenditure | 34% |
The survey received more than 67,000 responses from urban households across 307 districts, with individual questions receiving different response counts. m-www.localcircles.com
The implications are important.
Almost one-third of surveyed urban households planned no discretionary festive expenditure. Among those planning to spend, 83% expected to use savings to some extent.
This suggests that festive expenditure was being supported partly by accumulated savings rather than entirely by current household income.
The category preferences are also revealing:
- 72% of households planning discretionary purchases expected to buy clothing or fashion products.
- 45% planned purchases of appliances and furniture.
- 45% allocated expenditure towards travel and holidays.
- Only 6% indicated jewellery purchases.
These figures describe planned purchases, not confirmed transactions.
Nevertheless, the overall spending estimate of ₹1.97 lakh crore, against ₹2.10 lakh crore in 2025, suggests a more cautious urban festive season.
The pressure was not necessarily uniform across all households. Affluent consumers could continue purchasing premium products, while middle-income households reassessed their discretionary budgets.
The important distinction is that continued festive participation does not necessarily indicate stronger household purchasing power.
6. E-commerce and quick commerce: More transactions, different economics
Digital channels have become increasingly important in India’s festive consumption landscape.
The working research cites festive e-commerce sales projections of approximately ₹1.50–1.55 lakh crore, representing estimated growth of 25%–29%.
Quick-commerce platforms have also expanded their role in impulse purchases, packaged foods, personal care, beauty products and gifting.
An important finding from the early festive online sales period illustrates the difference between transaction growth and spending per transaction:
| Digital commerce indicator | Reported change |
|---|---|
| Order volumes | +31% |
| Gross merchandise value | +17% |
| Average order value | -10% |
| Quick-commerce orders | +85% |
These figures relate to the particular platform-tracking sample and festive window, not the entire Indian retail market. Industry News – Business Standard
The implication is nevertheless interesting.
More orders do not necessarily mean consumers are spending more on each purchase.
Smaller baskets, replenishment purchases and convenience-led transactions can increase order frequency without a corresponding increase in average expenditure.
For smaller FMCG manufacturers, digital platforms provide additional routes to market. But the economics must be examined carefully, including platform commissions, promotional discounts, fulfilment costs and repeat-purchase rates.
A higher order count does not automatically translate into higher manufacturer profitability.
7. What should FMCG MSMEs learn from Diwali 2026?
The market developments offer several practical lessons for regional manufacturers and smaller FMCG businesses.
1. Reassess pack architecture, not just selling prices
Manufacturers should evaluate entry-level ₹5, ₹10 and ₹20 packs alongside larger family packs. The objective should be to retain affordability without allowing product-level contribution margins to deteriorate.
2. Calculate the price-per-gram advantage
A lower printed price is not necessarily a better value proposition. Manufacturers should benchmark their products against national competitors on comparable grammage, quality and effective retail price.
3. Build regional distribution before expanding geographically
Smaller manufacturers should strengthen distributor relationships, retail coverage and outlet-level availability in selected markets before committing substantial resources to wider expansion.
4. Protect margins through procurement and product efficiency
Input-cost volatility requires better procurement planning, packaging optimisation, production efficiency and SKU-level profitability analysis. Repeated grammage reductions cannot substitute indefinitely for operational efficiency.
5. Monitor consumer offtake, not merely distributor orders
Festive stocking can create an attractive monthly sales number. Manufacturers must examine whether products are actually moving from retail shelves to households before increasing production or extending distributor credit.
6. Separate premium and mass-market strategies
Premium consumers and price-sensitive households are responding differently. Manufacturers should identify which customer segments they serve rather than assuming that aggregate FMCG growth represents an equally strong market across all income groups.
7. Manage working capital against post-festive demand
Inventory built for festive demand should be reviewed against actual replenishment orders. Excessive stock, slow-moving SKUs and delayed distributor payments can erode the benefit of higher festive turnover.
8. The post-Diwali test: Will the growth sustain?
October’s performance is encouraging, but the sustainability of demand remains an open question.
Three developments deserve attention over the coming months.
First, agricultural income. The deficient monsoon, lower kharif acreage and risks to crop yields could affect farm cash flows. Lower reservoir storage could also influence rabi sowing and subsequent agricultural output. The consequences may become more visible in rural consumption during the second half of FY2027. ICRA An Affiliate of Moody’s
Second, household savings. With a significant proportion of surveyed urban households expecting to use savings for festive purchases, the ability to sustain discretionary spending will depend on income growth, inflation and household financial commitments.
Third, retail inventory. Manufacturers and distributors must establish whether October’s higher product placement translates into sustained consumer offtake in November and December.
The next two months will help determine whether festive demand represents a broader consumption recovery or a temporary acceleration supported by calendar effects, advance stocking and price increases.
India’s consumer is changing. Are FMCG manufacturers adapting?
The September 15 MSME Briefing analysis, “Inflation May Change What India Buys Now”, anticipated that persistent food inflation could alter India’s consumption priorities ahead of Diwali.
The subsequent market evidence provides substantial support for examining that assessment.
FMCG sales value increased, but price increases, product grammage, distribution expansion and festive stocking all influenced the headline performance. Rural markets outperformed urban markets, although the underlying drivers extend beyond agriculture. Premium categories continued to find consumers, while mass-market products faced greater price sensitivity. Household expenditure surveys also indicated pressure on discretionary budgets.
For India’s regional FMCG manufacturers, these developments offer both opportunities and challenges.
The opportunity lies in understanding the changing consumer basket, offering competitive value, strengthening regional distribution and developing products suited to different income groups.
The challenge lies in protecting margins without sacrificing quality, managing inventory against actual demand and avoiding the assumption that higher sales value automatically indicates stronger consumption.
Recommendations for MSME manufacturers
Going forward, manufacturers should prioritise three commercial decisions:
- Re-engineer product and pack economics: Protect affordable price points while improving procurement, production efficiency and contribution margins.
- Identify the right consumption markets: Distinguish agricultural-income-dependent rural markets from industrial and non-farm employment clusters, and tailor distribution and product strategies accordingly.
- Measure volume and profitability together: Monitor consumer offtake, repeat purchases, average realisation, grammage and working-capital cycles rather than relying exclusively on turnover growth.
The fundamental lesson from Diwali 2026 is that FMCG market growth cannot be judged by sales value alone. What consumers buy, how much they receive, which brands they choose and how frequently they replenish their purchases will determine the sustainability of demand.
For MSME manufacturers, understanding this changing equation is no longer simply a marketing exercise. It is a business strategy imperative.
Sources and research acknowledgements
The following sources form the evidence base for this analysis. Figures from different trackers have different measurement periods and methodologies and should not be treated as one consolidated dataset.
- MSME Briefing: 15 September 2026 – Inflation May Change What India Buys Now.
- Bizom: October 2026 FMCG retail tracking and festive-season analysis. Bizom+1
- Ministry of Statistics and Programme Implementation: September 2026 Consumer Price Index and Consumer Food Price Index. Press Information Bureau
- India Meteorological Department: Southwest Monsoon 2026 rainfall assessment, as reported in the October 2026 monsoon review. Agriculture – Business Standard
- ICRA: October 2026 – Sub-par Monsoon, Low Reservoir Storage to Weigh on Rabi Sowing; Outlook for Rural Demand Remains Circumspect. ICRA An Affiliate of Moody’s
- Ministry of Statistics and Programme Implementation: Periodic Labour Force Survey, April–June 2026. Press Information Bureau
- LocalCircles: October 2026 – Mood of the Consumer: Urban Festive Spending. m-www.localcircles.com
- Datum Intelligence and Redseer: Festive e-commerce market estimates and digital retail tracking, as cited in the working research.
- NielsenIQ and institutional FMCG research: Category-level volume, consumer-panel and retail-market analysis, as cited in the working research.





Leave a Reply